
AI explainability (XAI) continues to challenge business to explain underlying reasons of a ML model behavior. With the advancement of various algorithm such as DL (Deep Learning – ANN, RNN, CNN, GPT, LSTM etc.) predictability has been increasing while inferabilty/explainability has been going south. While a huge dataset with tons of parameters provides lots of information about a particular process to a machine (algorithm), tuning hyperparameters (Regularization λ, gaussian width ω, no of epochs/passes, hidden layers h(n) in NN etc.) further complicates the training process. ML models have been making remarkable improvement in prediction for a particular process, but how do we decipher a trained model constructs to explain its behavior to stakeholders (consumers, regulators etc.). e.g. Explain rejection rate of loan, high vs. Low EMI, how is model un-biased on color, ethnic and so on. ML Model governance is a crucial element in Model Risk Management (primarily in Banking Industries). Lots of data might not be useful and sometime noise overrides signal while obfuscating the process behavior. Can we optimize (minimize noise & redundancy) data by reducing curse of dimensionality without losing valuable information? PCA is one of such techniques to reduce noise and redundancy in dataset while giving simple & easy structure to not only train model relatively easier but also help increase explainability. This article is an attempt to explain concept, underlying mathematics of PCA, hope data scientists, ML practitioners find useful.
What is PCA: PCA (Principal Component Analysis) is a data analysis technique to reduce dimensionality and extract useful features without compromising much on information. This method helps unravel structure of dataset (Matrix that encapsulates a process behavior) with less effort without sacrificing much of information. PCA could be compared to a greater extent with pareto analysis, Pareto rule gets us top 20% causes for 80% of outcome, a simple and effective causative technique to address problem with less effort.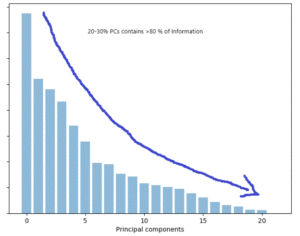
Information: We capture any process information in the form of the dataset/matrix (e.g. m number of observations with n attributes; mathematically X . Better spread or high variation in each of the attribute characterizes better magnitude of information. Conversely, many attributes add redundancy and noises that obfuscate/distort information. High correlation between variables (either + or -ve) are considered to be having redundancies in the observed set. So PCA helps to reorient matrix in such a way that maximizes variability (standard deviation) and minimizes covariance or correlation or redundancy in the new hyperspace.
Idea is to find hyperspace (multidimensional space) that maximizes the variability into each new axis for a given data set. In the original data set, information (variation) is scattered buried with noise and redundancy across multiple orthonormal axes, whereas in new (transformed space) axes same information can be distributed across axes with less of noise and redundancy. In addition to that we order axes in descending order so that we can pick high order axes having maximum information. We find very intriguing to draw insight or improve ML explainability if we have to depend upon multi-dimensional (many variables/attributes). It would be very confusing to relate how many attributes or variables are jointly affecting the output, be it “loan is declined” or “Risk score is High >90%” etc. PCA helps to find out top key drivers affecting output more heavily than others, so we can limit our analysis across few variables (combination or mixtures of variables).
How do we find new axes or new hyperspace, what is the angle and stretching magnitude that should be applied?
![]() For illustration purpose, I have generated 4 figures (Fig. 1: data points with 2 variables/features showing high variabilities along component 1 followed by component 2, Fig. 2: data points normalized and rotated, Fig. 3: dropped less variable component and kept high variable component, Fig. 4: rotated back to the original axes) that sketches the path of PCA transformation by dropping less important component while keeping most of information intact.
For illustration purpose, I have generated 4 figures (Fig. 1: data points with 2 variables/features showing high variabilities along component 1 followed by component 2, Fig. 2: data points normalized and rotated, Fig. 3: dropped less variable component and kept high variable component, Fig. 4: rotated back to the original axes) that sketches the path of PCA transformation by dropping less important component while keeping most of information intact.
I will be using a dataset of breast cancer for derivation/ illustration that I have downloaded from Scikit-Learn dataset. [Say X Matrix = cancer_data = load_breast_cancer()]; Dimension of X = 30 X 569 , meaning we have 30 attributes (dimensions) and 569 observation records of different breast cancer patients with malignant or benign . Some of the attributes are ‘mean radius’, ’mean texture’, ’worst radius’ etc… likewise, there are 30 that describes the characteristics of cancerous cell between malignant and benign.
Generalizing the above matrix, X = [x1, x2, …xn], where xi is the ith data observation of and each has d attributes (variables). We apply PCA to transform X à Y where Y has very low dimension while keeping most information(variation) in-tact.
Steps to transform Matrix(X) to Matrix(Y) such that  and
and  ; where p<< d (d, p are dimensions of X and Y respectively). We have to find p axes in the new hyperspace such that X ~ Y , meaning X and Y information is almost same.
- Data standardization or normalization to make learning process un-bias: We can apply
 across all set of values in the matrix X to normalize the effect. (Dataset normalizes by dividing data points differences from mean by variance or standard deviation)
 - Derive Covariance: Determine how attributes are related to each other? Higher absolute values correspond to higher redundancy in the matrix, since all such information is already captured in the variance.
Co-variance(X) = S= XXT  .This is a symmetric matrix that holds value representing how each attribute interacts with each other.
S produces matrix of d x d dimension = 
= 
Where  = covariance between ith and jth arguments, likewise, matrix S spans across 30 X 30 relationship, the diagonal cells represent the same attributes so they become variance.
Net result is S = COVARIANCE Matrix of XXT that represents relationship matrix for every pair of attributes.
- Find axes in hyperspace with maximum variance: As stated before, if we could change the frame of reference such that dataset gets us maximum variance in the new reference (or axes) then we can absorb almost all information in smaller number of axes or extracted attributes (features in new space) as compared to number of attributes in original matrix.
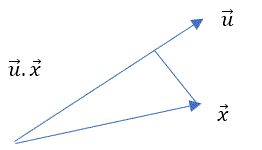
Let’s assume u is the vector direction (one axis) with maximum variability for data point x.
We should find u for which var (u.x) is maximum.
Same applies to the matrix X 
So our objective function is maximize variance (u.X)
f(u) = variance(u.X) = (u.X) (u.X)T = uXXTuT = u. XXT.uT = u.S.uT
This is the optimization function, this takes the form of quadratic function with u as unknown variable and value for u can go infinity, so we have to put some constraint. Our interest is to find the direction of u and not the value of u.
So we can limit the value of u to any fixed value, lets that be 1.
uTu=1
We can present the constraint equation as Lagrange optimizer as below: –
L(u,λ) = u.S.uT – λ(uTu-1)
 = 2.S.u – 2 λu = 0 (partial derivative of L w.r.t u to search for saddle point- max or min)
S.u = λu –> (This equation is the form of Eigen Vector and Value)
S is Co-variance matrix for X, and u is the eigen vector of S, λ is the eigen value (stretch) for u
How many Eigen Vectors are there in X: S (Co-variance of X) is d X d dimension, so we will have d eigen vectors and d eigen values, for every u a corresponding λ will be there.
Another approach to determine u and λ is (SVD)Support Vector Machine. In my earlier blog, we established the fact that for every matrix (X) we can decompose into three sub matrices i.e.
X = U∑VT (Where U is eigen vectors for XXT , V is eigen vectors for XTX and ∑ is stretching values of eigen values for U or V). ∑ is already sorted in the descending order and corresponding U vectors in columns represents eigen vectors.
From both the methods, vector U as eigen vectors are nothing but Principal Components (PC).
Intuitively, we have changed the frame of reference from original axes to principal components (PC) axes to observe same data points, we sorted PCs in descending order basis upon eigen values, λ1> λ2> λ3…….> λd and pickup respective u1, u2…. ud, as PCs. Magnitude of information decreases from high order to low order PCs, so we can easily reduce dimensionality by picking 20%-30% of top high order PCs. Most of the information stays with top order PCs so we need not carry all d attributes in the new space.
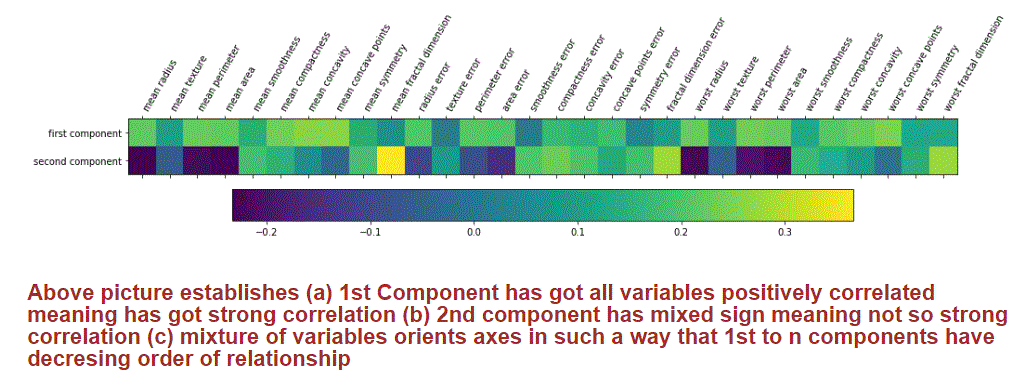
Illustration: I picked up 2 PCs out of 30 PCs from Breast cancer Dataset after transforming original dataset of size 30 x 569 through PCA. These 2 PCs contains significant information for us to classify a new cancerous. The heat map shows how each one of the original attributes is contributing to both principal components.
Conclusion: PCA is used to reduce dimensionality to improve training speed and extract informative features. This helps in analyzing data (process information) by underscoring top attributes in contributing the outcome. PCA helps in ML model explainability by unravelling latent attributes relationship and their characteristics. PCA and SVD are some of incredible mathematical methods to decipher intertwined relationship amongst attributes, once we unravel some of these, explainability of ML model behavior becomes easier. PCA, SVD, tSNE, NMF etc. are some incredible methods to reduce curse of dimensionalities and extract valuable features for ML training. Hope Data Scientists and ML enthusiasts find this article helpful.